It’s easier to work when your desk is well-organized and every item has its own place?
Well, the same goes for your website KPIs dashboard.
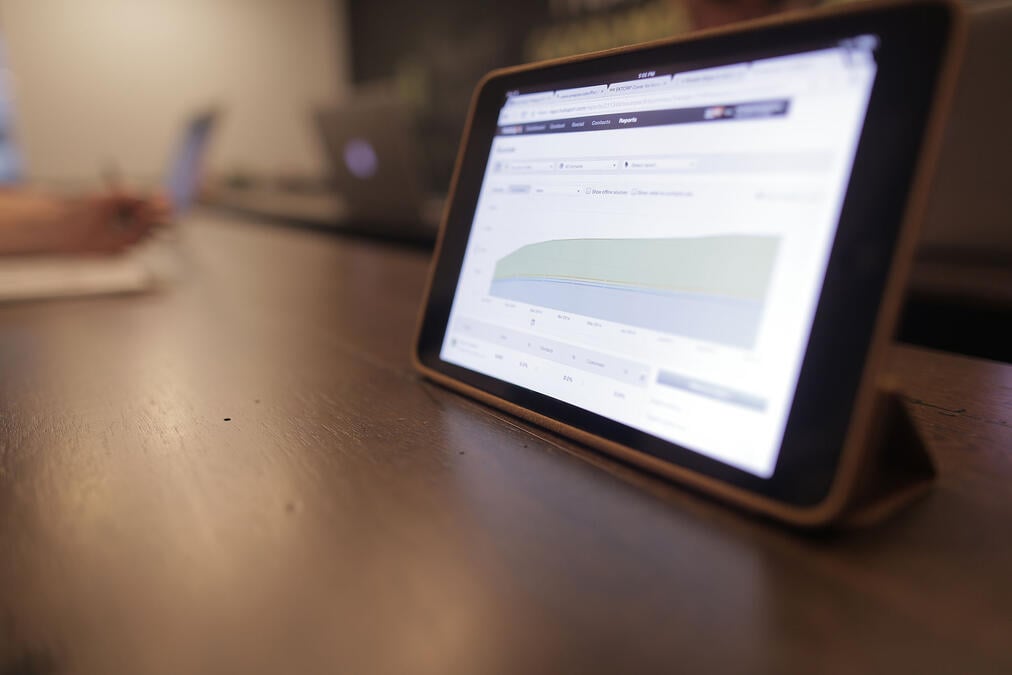
It’s the reporting interface you see when you open your analytics tool and it helps you monitor selected website performance metrics so you can evaluate the performance of your website.
A tidy view allows you to monitor data more efficiently and effortlessly.
Creating separate dashboards for different goals and departments may help you do just that.
Take a look at the top five website KPIs dashboards you should consider using.
-
Blog Performance Dashboard
Is your blog driving traffic to your website? Which blog posts are most interesting to your target audience?
If one of your goals is to attract visitors with a strong content marketing game, monitoring your blog is a must.
With a blog performance dashboard, you can track all the relevant KPIs that can show you what aspect of your website you can improve to get the most out of your blog writing efforts.
Here’s what to measure:
- Pages per session
- Returning visitors
- Dwell time
- Goal completions
- Bounce rate
-
Landing Page SEO Dashboard
Have you used every on-page SEO trick from the book to optimize your website? This dashboard can show you what pages have the best performance in this sense.
You can learn which landing pages get the most organic traffic and which ones need additional attention. Moreover, you can obtain information about search queries that lead visitors to your landing pages, so you can improve your SEO strategy in the future.
You can track the following KPIs:
- Number of organic sessions
- Top organic landing pages
- Organic clicks by page
- Organic clicks by queries
-
Website Traffic Dashboard
One of the basic KPIs to track when you want to measure your website performance is website traffic. The volume, the source, the keywords… All this data can give you valuable insight into your audience and help you get to know them better and adjust your marketing efforts accordingly.
Website traffic dashboards can tell you how much traffic your website gets daily or monthly, and you can compare them to previous months to make sure your progress is on point.
Some of the KPIs you may want to track are the following:
- Number of new visitors
- Number of returning visitors
- Traffic by source
- Pages per session
- Average session duration
-
E-commerce Dashboard
If you’re running an e-commerce website, a dashboard that gathers all the relevant metrics and KPIs to help you improve your performance is absolutely necessary. An overview of your ecommerce store’s activity can help you measure your progress and increase your revenue.
You can track the number of transactions made during a specific time range and compare it to the same period of the previous month, or monitor the total amount of money generated through sales via your website.
Include some of these KPIs in your dashboard:
- Transactions
- Revenue by channels
- Revenue by product name
- E-commerce conversion rate
-
Mobile vs Desktop Traffic Quality Dashboard
Did you know that the newest stats show that over 84% of people have trouble when completing a purchase on a mobile device? That will drive them away right to your competitors, so make sure your website is fully responsive on mobile devices.
Comparing mobile and desktop traffic quality can help you determine where your audience spends more time. Use the data to fix potential glitches and maximize both mobile and desktop user experience.
You may opt for some of these KPIs:
- Sessions by device type
- Pages per session by device type
- Bounce rate by device type
- Percentage of new sessions by device type
-
Dashboards for Measuring Your Success
Of course, your dashboards will depend on your website type and your business goals.
The ones we described can provide you with a lot of useful data that you can apply to your marketing activities, sales process, and even technical aspects of your website to create the best user experience possible for your visitors.
Are you ready to pick the dashboards for your website?


.svg)

.svg)